Discover new data flow
Optimize and Analyze
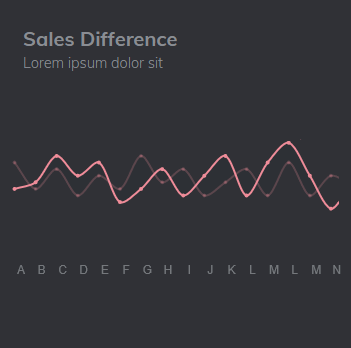
Optimize and Analyze Strategies
Maximize your results with data-driven strategies.
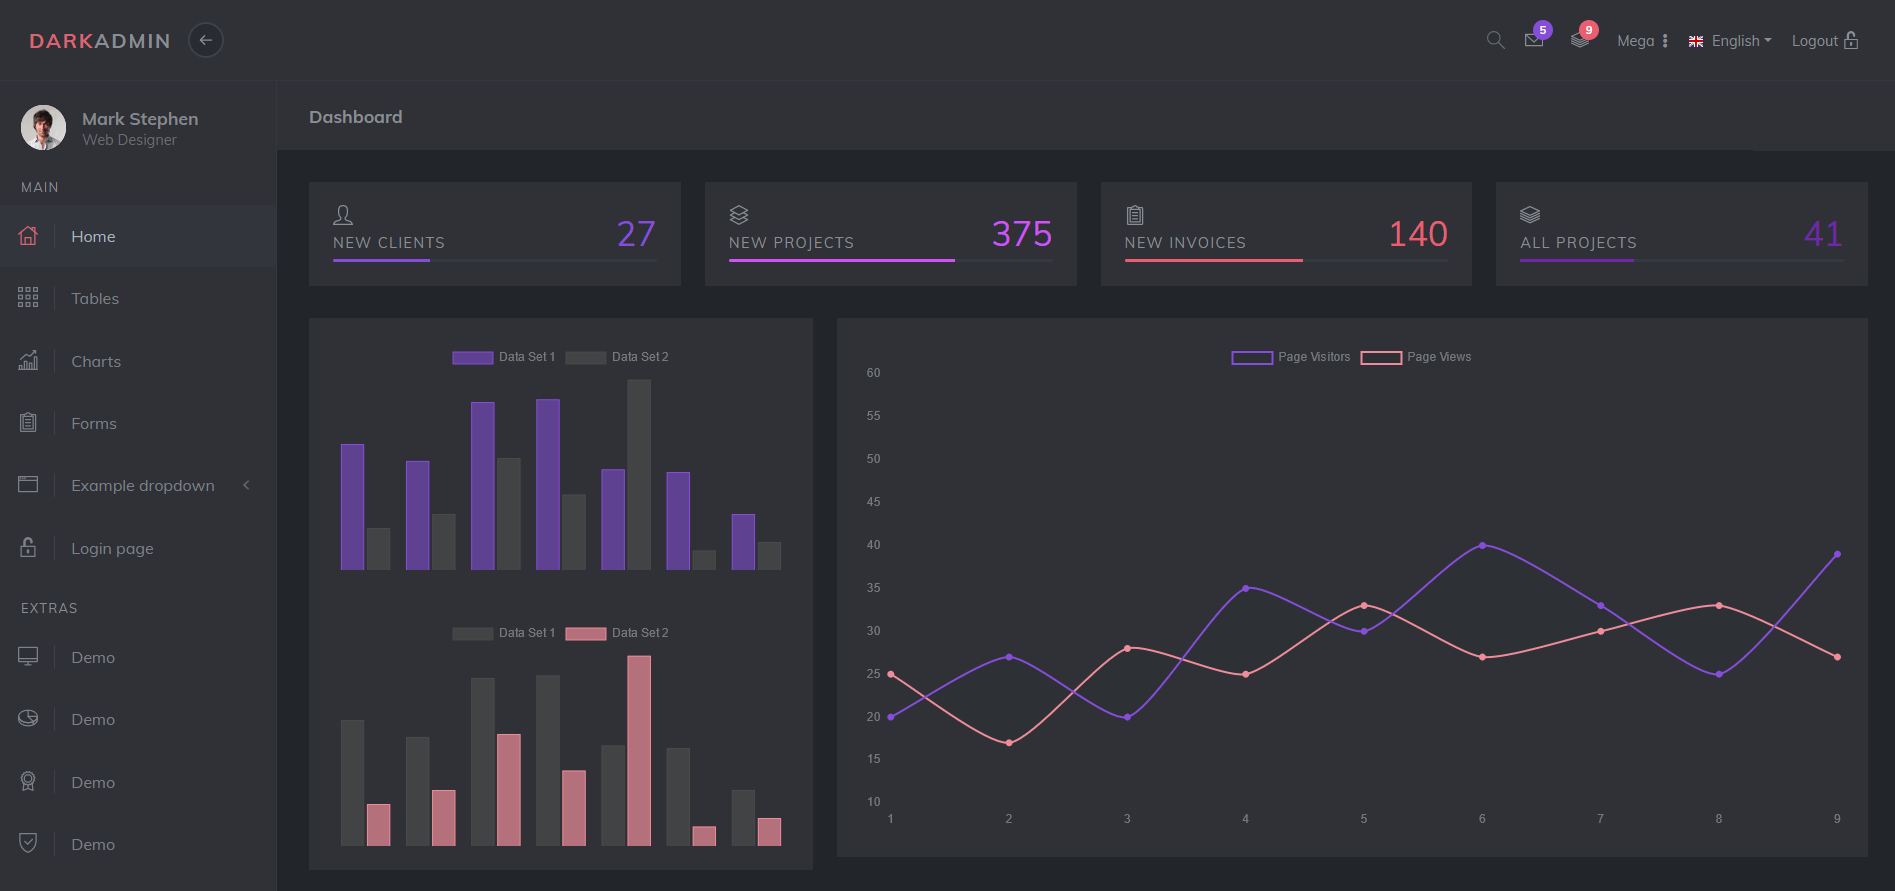
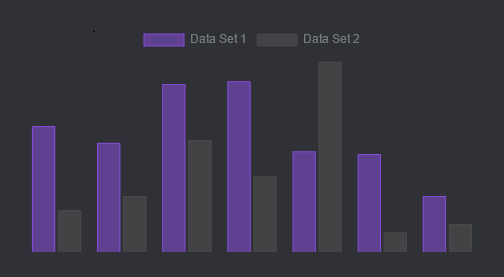
Professional Backtesting Platform
Test and validate your trading strategies with our comprehensive backtesting platform. Make data-driven decisions using historical market data and advanced analytics.
- Historical market data analysis
- Performance metrics & risk assessment
- Multi-asset strategy testing
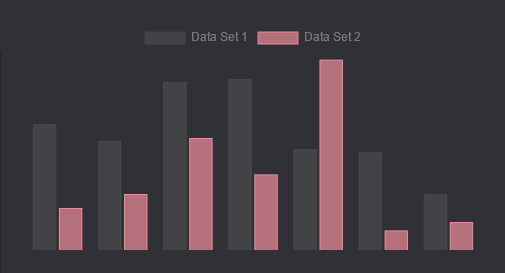
Backtest and optimize your trading strategies
Fine-tune your trading strategies with parameter optimization and heatmap analysis. Test your strategies against historical data and visualize performance metrics for better decision making.
- Parameter heatmap visualization
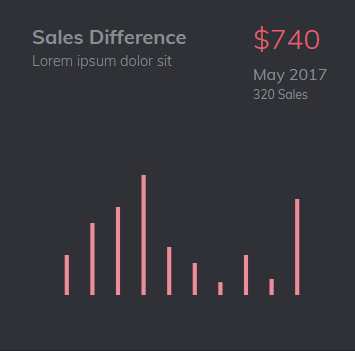
- Strategy performance metrics
- Custom indicators support
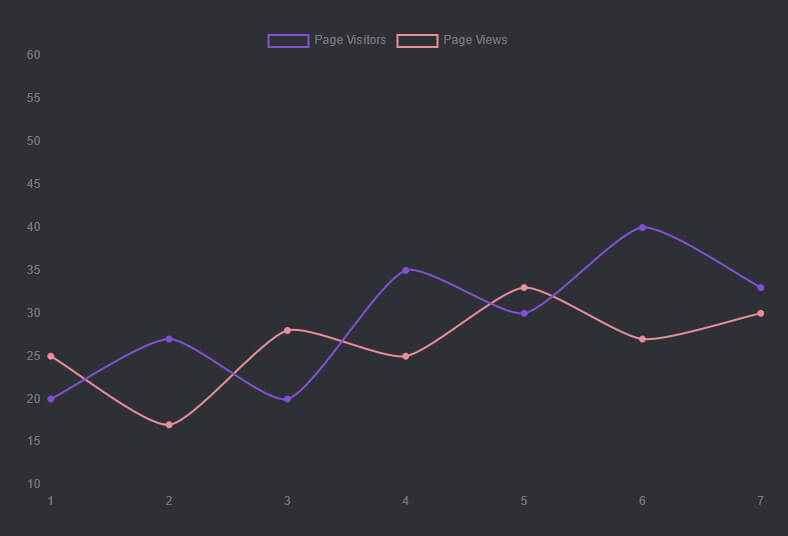
Live Testing for Optimal Results
Test your strategies in real-time with our advanced simulation platform. Optimize performance through live data analysis and instant feedback. Make informed decisions with comprehensive testing capabilities.
Have any questions?
Frequently Asked Questions
How do I create a custom trading strategy?
To create a custom strategy, subclass Strategy and implement at least the 'init()' and 'next()' methods. The 'init()' method is called at the start and sets up indicators, while 'next()' is called for each new candlestick and contains your trading logic. Use self.buy(), self.sell() to place orders, and access indicators and price data through self.data.
How do I handle commission and spread costs in backtesting?
You can account for commission by setting the commission parameter when initializing a backtest. For example, if your broker's commission is 1% of trade value, set commission to 0.01. To account for bid-ask spread, you can approximate it by increasing the commission - e.g. set it to 0.0002 for commission-less forex trading where the average spread is roughly 0.2‰ of asking price.
How do I analyze my backtest results?
It provides comprehensive statistics through the backtest.stats() method. This includes key metrics like Sharpe ratio, max drawdown, win rate, and return metrics. You can also visualize your results using backtest.plot() to see equity curves, individual trades, and indicator values. For deeper analysis, access raw trade data through backtest.trades and backtest.positions.
Can I trade in both directions simultaneously?
Yes, this is controlled by the hedging parameter. If hedging is True, the system allows trades in both directions simultaneously. If False, opposite-facing orders first close existing trades in a FIFO manner. Additionally, if exclusive_orders is set to True, each new order auto-closes the previous trade/position, making at most a single trade (long or short) in effect at each time.
How can I optimize my trading strategy?
You can optimize your strategy using Backtest.optimize(). The framework provides tools like parameter heatmaps and optimization capabilities. You can visualize optimization results using plot_heatmaps() function, which plots a grid of heatmaps for every pair of parameters. The heatmaps can be aggregated using different functions (default is 'max') when projecting n-dimensional results onto 2D.